


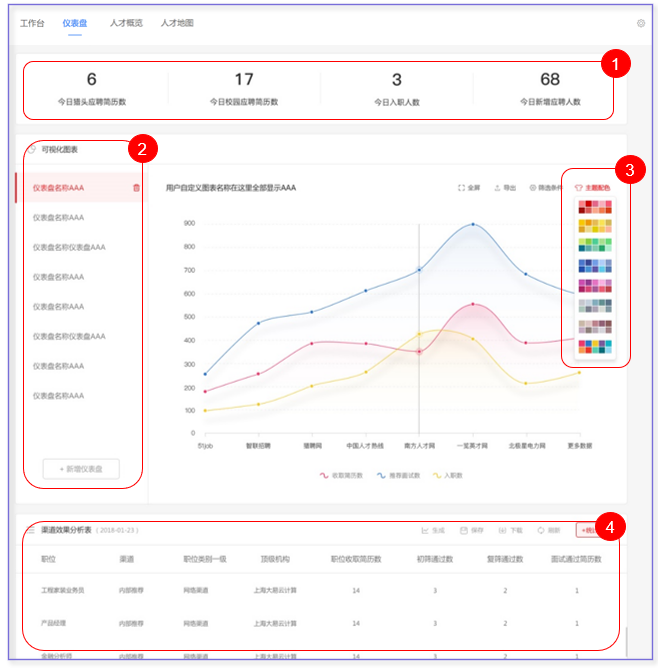
Instrument panel
1.In the Key indicator statistics area, you can click the Settings icon in the upper right corner of the area to set which key indicators are displayed here. A maximum of 4 indicators can be set at the same time, and the mouse can replace the indicators
② Dashboard area, you can add and display the charts defined by the user in [Report Center] - [Dashboard] - [Dashboard folder]
③ The system provides a variety of theme colors, which can be customized to choose and modify the chart theme colors
④ Report area can be added to display the report defined by the user in the Report Center
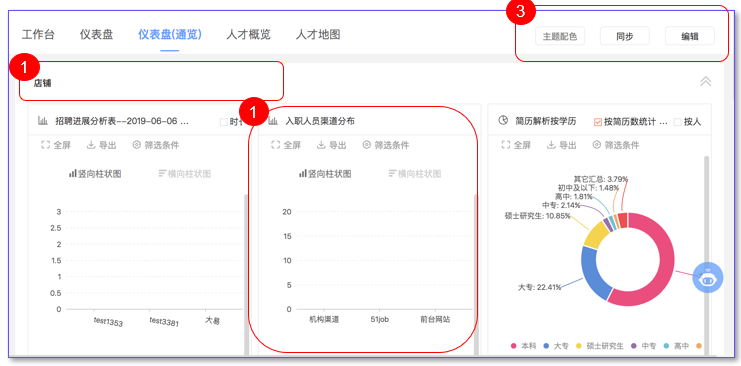
Dashboard (Overview)
① User-defined region name Region: A display area of the user-defined dashboard to fill reports in
② Report display area: Displays the report graph, and the data comes from the report center
③ Operation area: Set the theme color of the report, share users, edit custom areas